Oregon DEQ measurements illustrate remarkable decline in airborne pollutants
Chuck Thompson, April 28, 2020. If you think you’ve been able to see those mountains on the horizon a little more clearly in recent weeks, you’re not imagining things. Partly a result of stay-at-home orders related to the COVID-19 pandemic, air quality across the Columbia River Basin has dramatically improved.
“Over the past few weeks, we’ve seen about a 40 percent reduction in several pollutants related to vehicle emissions, specifically nitrogen oxides and black carbon, which is also known as soot,” said Laura Gleim, spokesperson for the Oregon Department of Environmental Quality (DEQ).
DEQ’s numbers track neatly with traffic figures from the Oregon Department of Transportation (ODOT).
“In general traffic has declined about 40 percent pretty consistently around the state since Governor (Kate) Brown’s ‘stay home’ order,” according to ODOT spokesperson Don Hamilton. Governor Brown’s COVID-19-related order came on March 23.
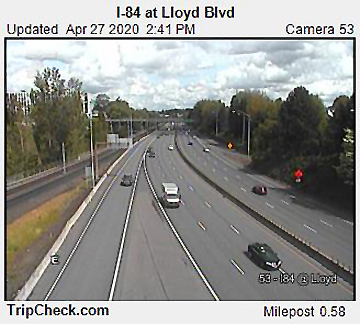
On a typical Monday afternoon, drivers might despair at joining traffic on Portland’s Banfield Expressway (I-84). These days it’s mostly smooth sailing.
Though fewer vehicles on the road helps, the similar numbers gathered by each agency don’t necessarily indicate a direct alignment between percentage decrease in traffic and percentage improvement in air quality. In other words, it’s not all about COVID-19.
“It’s important to note that some of the fluctuation we’re seeing is because of changes in weather—wind speed, direction, temperature,” said Gleim. “Pollutants rise and fall based on weather.
“There’s also less smoke in the air from fires right now. There are fewer controlled burns going on, it’s warming up so people are using their woodstoves less, and we thankfully haven’t seen any major wildfires yet. This has all led to cleaner and clearer air quality in the state. We’re able to see faraway mountains, for instance.”
DEQ figures for late March show average concentrations of nitrogen oxides and black carbon down between about 27 to 32 percent from the same period in 2019.
Trending: cleaner air
Oregon DEQ tracks several air pollutants in vehicle emissions at an air-monitoring site near I-5 in Tualatin, just south of Portland. It analyzes data for nitrogen oxides (presented in parts per billion) and black carbon (presented in micrograms per cubic meter).
Two DEQ charts illustrate the dramatic improvements in air quality since the COVID-19 crisis began.
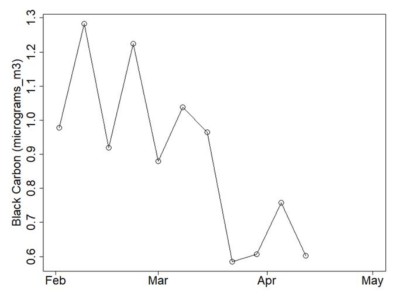
[/media-credit] Black carbon emissions DEQ April 2020.
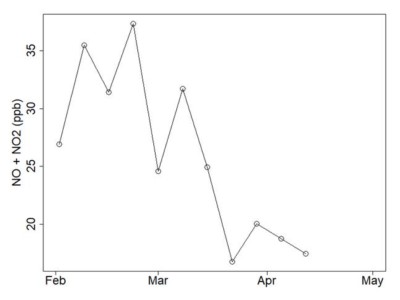
[/media-credit] Nitrogen Oxides emissions, DEQ April 2020.
DEQ’s Tualatin monitoring site can serve as an indicator of statewide trends. DEQ doesn’t monitor for specific pollutants in other areas of the state because total traffic volume is much lower outside the Portland-metro area. Lower traffic volume results in lower ambient concentrations of vehicle emission pollutants.
“We’re tracking nitrogen oxides and black carbon specifically during this period because they’re good indicators of vehicle emissions more broadly,” said Gleim.
Not clear everywhere
In other parts of the Columbia River Basin, it’s still too early to definitively say what effect, if any, COVID-19 shelter-in-place restrictions are having on air quality.
“There’s some significant air quality differences in some cities and areas. In Idaho, we just aren’t seeing that quite yet,” said Steve Miller, air quality data bureau chief for the Idaho Department of Environmental Quality. “It is still too early to definitively quantify any differences in air quality that may be occurring due to COVID-19 and its effects on commuting and other things.
“Additionally, we have been having primarily good air quality in Idaho prior to and during the COVID-19 event, so it is more difficult to decipher such information.”
While vehicle traffic has been reduced across the Pacific Northwest (and world) as a result of COVID-19 regulations, pollutant particle levels in the air aren’t consistent across the region. In fact, in some densely populated residential areas, air quality has gotten worse.
On April 20, Tacoma’s News Tribune reported air quality in Puget Sound has actually declined this spring.
“With many Puget Sound-area residents staying home, people have been using wood-burning stoves for home heating. Others have been making outdoor fires,” according to the News Tribune.
The Seattle Times cautioned those pinning improvements in air quality on broader issues related to global climate change shouldn’t get their hopes up just yet. In the short term, reduced car emissions won’t make a difference in global warming, according to the Times.
“A lot of people are saying this is good for the climate problem. No, not really,” the Times quoted Pieter Tans, a senior scientist with the National Oceanic and Atmospheric Administration’s Global Monitoring Division.
View from space
In general, however, air quality has improved as COVID-19 shelter-in-place orders have led to decreases in travel and traffic around the world.
NASA’s Aura satellite data—which orbits 438 miles above the Earth—has returned images that show remarkable decreases in pollution over China, India and other countries.
This fascinating NASA slide graphic shows the incredible impact of stay-home orders on pollution in the Northeast United States.
“March 2020 shows the lowest monthly atmospheric nitrogen dioxide levels of any March during the Ozone Monitoring Instrument data record, which spans 2005 to the present,” according to NASA. “In fact, the data indicate that the nitrogen dioxide levels in March 2020 are about 30 percent lower on average across the region of the I-95 corridor from Washington, D.C. to Boston than when compared to the March mean of 2015-19.”
The East Coast is far beyond views from the Columbia River Basin. But the NASA pictures show an undeniable if unintended impact of stay-home orders. At least in the short-term, distant views are improving.






I’m glad the levels of NOx and soot have decreased, but thankfully the data from those two years looks to be well under the clean air act’s ambient air quality standards. I certainly wish there was more air monitoring in the Gorge, it seems like the most recent air monitoring strategies from DEQ are 10 years old. A scenic area can’t function very well in hazy conditions.
It’s a shame that decreasing transportation alone won’t flatten the CO2 curve, but the observation of less traffic on the road must mean less CO2 is being created, which should teach us something.
Jim, when I worked for the USFS at the Gorge Scenic Area I helped set up an air quality monitoring station at Wishram, WA. WA, OR and SW Washington Air Quality agencies used this information to chart Gorge Air Quality. That was sometime around 2010-12. My good information was collected for a number of years. Unfortunately some time just a few years ago the USFS ended air quality monitoring programs managed by the USFS Regional Office. They say they ended the programs due to funding cutbacks. Now those staff don’t even know about the history of what we did. Very sad. Read more at Tom Kloster’s WYEAST blog….https://wyeastblog.org/2019/02/28/farewell-forest-service-webcams/
Jurgen Hess
With the predominant west winds, Hood River and surrounding land is ‘eating’ Portland’s pollution. I remember moving away for 5 y ears and in coming back my first remark was that the air is cloudy (polluted) and not so blue. If we want clean air that does not harm our forest we need to work on Porltand’s environment. And we all need to seriously consider electric cars.
I remember a walk up to the overlook bluff by Black Lake. There was a small cluster of young fir trees, 5 – 8 ft. tall that looked to have been killed by chemicals. Always wondered if that was the effect of heavy pollution hitting them when they were so young.
So sorry your data has not been followed up on Jurgen. But if they were even to restart collection it would be valuable.
This is Rachel Pawlitz, the official spokesperson for the Columbia River Gorge National Scenic Area. It is NOT correct that the Forest Service stopped air quality monitoring. It is only the webcams that were discontinued. There are other webcams in the Gorge and it was not the source of data. Our data collection continues.
Thank you for that clarification, Rachel. Good to know that data collection continues.
When graphs are posted, I would appreciate that the Y-axis begin at zero. When they are not, the visual representation of the data is distorted.